We ran Google Ads for a local Dutch real-estate rental agency through and out of the COVID period — the window during which Dutch private-rental demand briefly evaporated and then snapped back. Two years of work, two trajectories: from mid-2020 into early 2022, cost-per-lead fell from around €90 to about €25 while quarterly conversion volume climbed from the high-30s to the low-100s. Then, when restrictions loosened in early 2022, the same campaign architecture absorbed the demand spike — conversions per quarter rose another ~57% to about 165, with cost-per-lead holding steady. Blended across the whole 24-month window: 32.5K clicks, 649 conversions, €41.90 average cost per conversion, €27.5K spend.
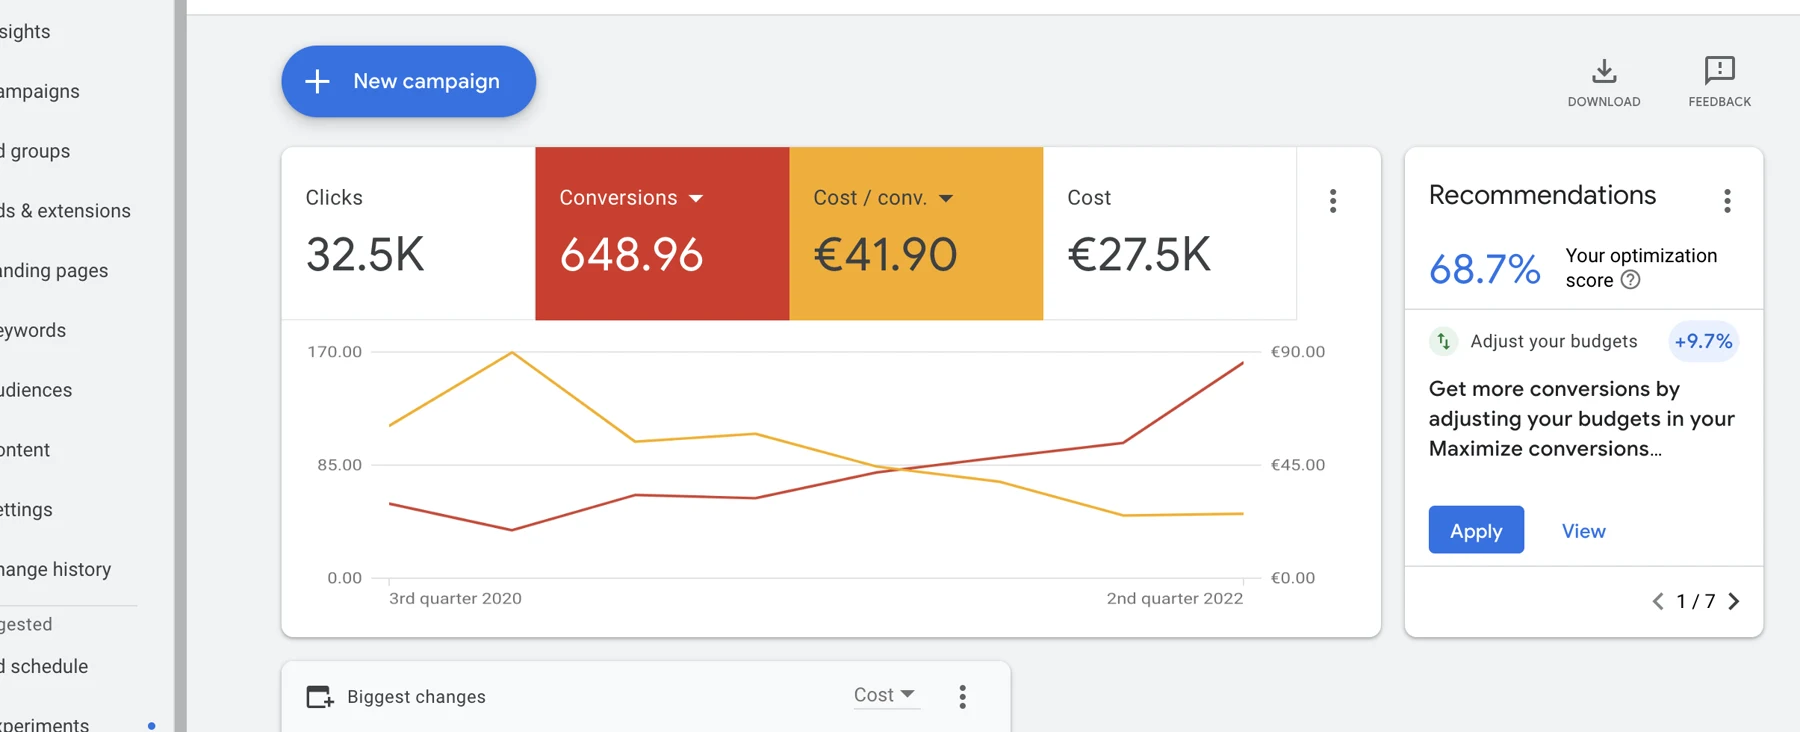
Read the chart left to right. The yellow cost-per-conv line peaks in Q3 2020 near €90 — the first pandemic quarter, with rental demand still locked down — then descends in steps through 2021 and lands around €20-25 by Q2 2022. The red conversion-volume line moves the other way: a flat low base in 2020, rising consistently through 2021, accelerating into Q2 2022 as restrictions lifted. The blended average across the 24-month window hides the trajectory; the chart shows it.
What we did: refine, reallocate, and let the architecture absorb the snap-back
The starting account had broad keyword coverage and ad copy that addressed the agency’s full service mix rather than the specific rental-search intent that actually converted. We split the campaigns around the intent layer that matters in this market — people searching for a rental in a specific area, with a specific bedroom-count or price ceiling in mind — and let the rest fall away. Ad copy moved from generic agency-introduction to direct address of the rental query, with the listing page as destination.
In a single-city rental catchment, the long tail is not where the volume lives — it's where the budget leaks. The work was to identify which clusters were generating actual rental applications versus which were generating browsing traffic dressed as intent.
Once the campaigns were structured around intent rather than service mix, reallocation became mechanical. Quarter by quarter, we pulled spend from clusters where cost-per-conv was running above the agency’s tolerance and pushed it into the ones where the unit economics worked. The chart’s yellow line is what this looks like over 24 months: a stepwise descent rather than a single intervention, because the work was iterative — each quarter’s spend pattern was a function of the previous quarter’s conversion data.
Money moved out of low-yield clusters and into the ones converting.
By Q1 2022, the campaign had stabilised at roughly €25 per lead and about 105 conversions per quarter. When pandemic restrictions eased and rental search-demand returned in volume, we didn’t have to rebuild — the intent-mapped structure absorbed the extra demand. Quarterly conversions rose by about 57% to around 165, and cost-per-lead held steady at €25. The win in this second phase was not the work; it was that the work from the first phase compounded.
When restrictions loosened, the campaign could absorb the demand without re-architecting.
By the numbers
The blended figures across the engagement: 32.5K clicks, 649 conversions, €27.5K total spend, €41.90 average cost per conversion. The trajectory is what matters: cost-per-lead from a Q3 2020 peak around €90 down to roughly €25 by Q1 2022 (−72%), with quarterly conversion volume climbing from the high-30s to the low-100s. Then, post-restriction-lift, conversions per quarter rose another ~57% to about 165 while cost-per-lead held.
Cost per conversion, Q3 2020 pandemic-hit peak to Q1 2022 stabilised floor.
Two years, two trajectories — and a campaign that didn’t need rebuilding when the market came back.
Boring, predictable, attributable. That’s what good PPC looks like.
Every engagement starts with a 30-minute audit — free, no slides, just a screen-share through your account.
Book the audit →