We managed the Google Ads programme for a Dutch real-estate rental agency operating across multiple regional branches, each chasing tenants in its own catchment. The brief from the operator was simple — drive viewing-requests at a defensible cost per lead, and do it consistently across all branches without one city subsidising the others. Over 24 months across the COVID-19 reset and the recovery that followed, the account moved 327K clicks, 6.78K conversions, and €171K of spend at a €25.05 blended cost per conversion — descending from a starting €50 to a sustained €13 by the back half of the engagement.
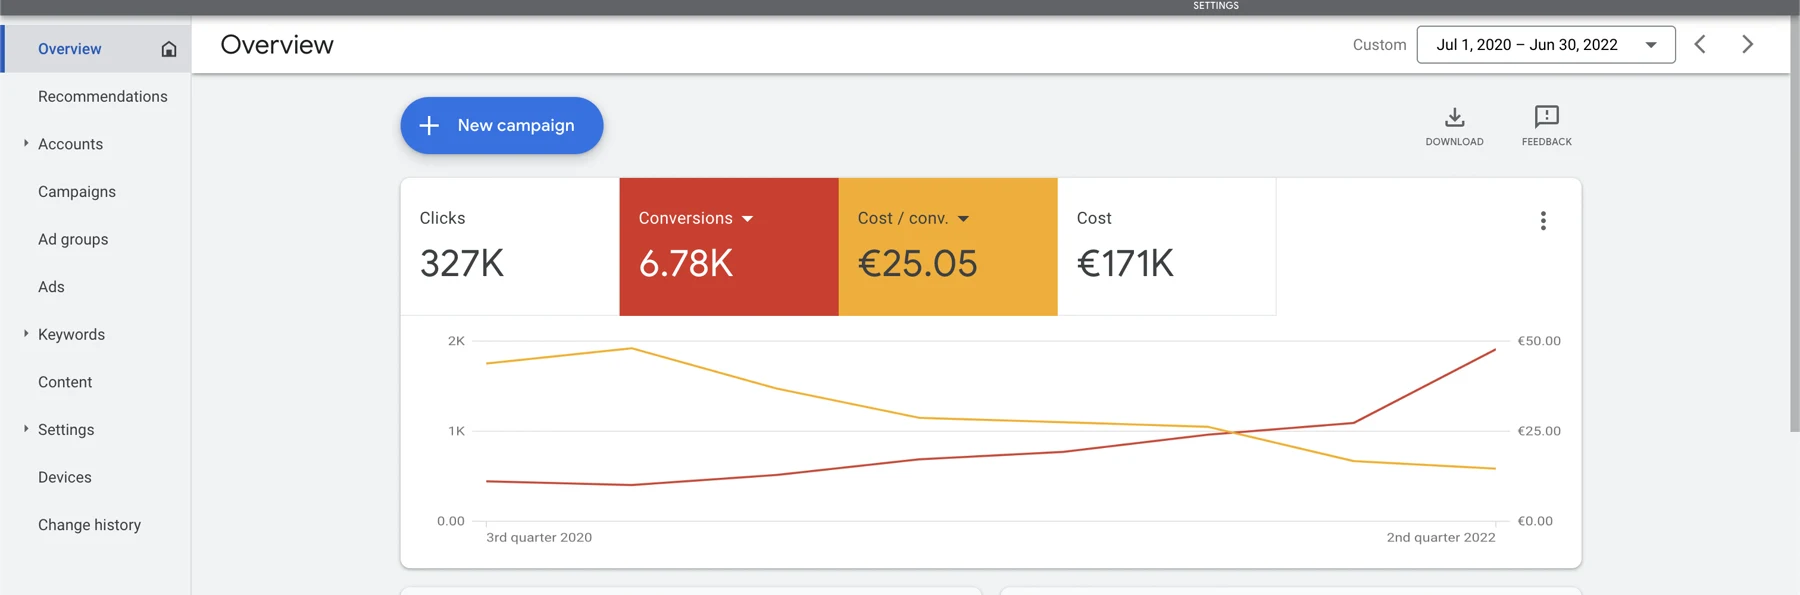
Read the chart left to right across eight quarters. The yellow cost-per-conv line opens above €50, steps down through 2021 as the conversion-tracking rebuild and per-branch budget controls settle, and finishes near €13 in Q2 2022. The red conversion-volume line climbs in parallel — from a baseline of a few hundred conversions per quarter in mid-2020 to multiples of that by the end. The €25.05 figure is the 24-month blended average; the running rate by the back half of the engagement is materially lower than the average suggests.
What we did: treat each branch like its own account, then add the budget discipline back at the parent
The first job was the conversion signal. Each branch was running its own listings, its own viewing-request flow, and its own phone number — and the lead-tracking on top of that was a patchwork.
We rebuilt conversion tracking so a viewing-request from any branch landed in Google Ads as a discrete primary conversion action, attributed to the campaign that drove the click, with the call-tracking layer feeding the same signal. Once that was clean, the bidding had something honest to optimise against.
For a multi-branch portfolio, the cost of a partially-broken conversion signal is not just a higher CPA — it is one branch's spend silently subsidising another, with no way to see it in the data.
The instinct in a multi-branch account is to run one big Search campaign and let the keywords carry the geography. That doesn’t survive contact with rental search behaviour — tenants type a city, a neighbourhood, a price band, sometimes all three.
We rebuilt Search around per-branch campaigns with their own catchment radius, their own ad copy referencing the local market, and their own budget envelope so a hot branch couldn’t drain a slower one’s spend mid-month.
Each branch's catchment treated as its own campaign, not a keyword.
The engagement straddled the second half of 2020 and the recovery through 2022 — a period when rental demand was not a flat line. As the market loosened up after pandemic restrictions, viewing-request volume per click rose materially; the response was to expand budget into the branches where the cost-per-conv was actually dropping, and to pull budget back from branches where the signal was thinning.
The €13 trough in the back half of the engagement is the visible output of that rotation. Across the full 24 months: 327K clicks, 6.78K conversions, €171K of spend, €25.05 blended cost-per-conv — with the running rate by the end closer to half of that.
Budget rotated through the cycle, not held constant against it.
By the numbers
The blended figures across the engagement, taken from the MCC view of all branches aggregated: 327K clicks, 6.78K conversions, €171,000 total spend, €25.05 average cost per conversion. The trajectory is the more honest read — cost-per-conv stepped down from a starting ~€50 to a sustained ~€13 by the second half of the engagement, while conversion volume climbed in the opposite direction.
Cost per conversion, start to end of engagement. Start · Q3 2020 to End · Q2 2022.
Across a portfolio of branches, the win isn’t a single average — it’s making sure no branch is silently subsidising another.
Boring, predictable, attributable. That’s what good PPC looks like.
Every engagement starts with a 30-minute audit — free, no slides, just a screen-share through your account.
Book the audit →